The Real Global Warming Problem
For the last few years, there has been something of a controversy about changes in the composition of the atmosphere. Rumor has it that "greenhouse gases" (GHG) have increased in concentration, in turn causing global temperatures to rise. You may have heard about it. The former Vice President mentions the topic occasionally.
Despite overwhelming evidence that bovine flatulence releasing tons of pre-warmed methane up into the sky is a primary cause (http://www.cbc.ca/news/background/kyoto/ewe.html), it is most often asserted that the real chief culprit among such greenhouse gases is carbon dioxide.
As the graph below shows, this evil gas has been increasing in atmospheric proportion since about 1855. Note the curve- roughly linear from 1855 to 1960, with an upward spike from then till the present (Michael Mann’s famous "hockey stick"). Speaking of which, what was Mann doing messing with these hockey sticks instead of "Miami Vice", "Starsky and Hutch", or "Last of the Mohicans"? But I digress.

Now, in search of the true causes, let us look at the critical elements of history over these last 150 years that have been characterized by the accelerating CO2 concentrations. People say it is cars and power plants. Perhaps those sources might contribute, as do six billion humans who insist on not only inhaling, but exhaling 20 times a minute.
But, from http://inventors.about.com/library/weekly/aa091699.htm, we learn the sickening truth: ginger ale was invented in 1851. The term "pop", to describe carbonated beverages such as "soda pop", was coined in 1861. By 1876, root beer was being mass produced for sale.
Then came the big ones- the first cola drink in 1881 was succeeded by the invention of Dr. Pepper in 1885, closely lagged by the upstart Coca Cola in 1886, and then Pepsi-Cola in 1898. The "crown bottle cap" moved these poisonous beverages from the drugstore soda fountains into bottles kept in peoples’ homes, available to drink at any time, prompting unlimited growth in consumption. The barn door had now officially been blown off its strap hinges.
In accordance with the best current standards of scientific proof (that is, if you can find some piece of data somewhere to support your "deeply held beliefs"), the new statistical reality is that "correlation equals causation". We thus hereby claim that irrefutable proof, even better than the evidence that drove the Alar scare or magnetic fields from cell phones causing brain cancer. We now KNOW the anthropogenic causes of global warming.
It is obvious that the fundamental reason for the increasing levels of CO2 in the atmosphere is not humans burning fossil fuels, cow flatulence, or any similar phenomenon. It is the event that occurs millions of times each day, and mostly in the evil, cowboy, capitalistic world of George Bush’s "poisonous water and poisonous air" America: the "pffft" sound we hear every time another can top is popped or bottle cap is unscrewed.
Each time we pop open another can, that poison gas and pollutant, carbon dioxide, is carelessly and thoughtlessly released into the atmosphere to do its evil work, work such as melting the polar ice caps so that sea levels in Tuvalu drown the desperate population, icebergs are calved off of Antarctic glaciers into the sea, and the formerly snow-capped mountains of Kilimanjaro turn in to hilly deserts, thereby screwing up the local economy.
The cause, humans, is YOU- you selfish American consumers of Coca Cola, Pepsi, Dr. Pepper, and various brands of root beer, ginger ale, and so on.
Consider the data: at the beginning of this greenhouse gas tragedy in 1886, Coca Cola sold a total of 25 gallons of syrup to drugstores, and there were no real "bring home" sales because the stuff would go flat in those poorly sealed jugs. That 25 gallons made up about 200 gallons of ("old", not "The New") Coke, which, based on US population in 1890, equated to .0000031 gallons per person per year.
By 1999, according to Beverage Marketing Corporation (BMC), Americans were swilling 14,930 million gallons of the stuff (for the math-challenged among us, that is 15 billion gallons), which is about 55 gallons, per person, per year, an increase of umpty-ump times as much, a scientific-looking number with a big exponent- my calculator doesn’t have enough display capacity to actually show the number.
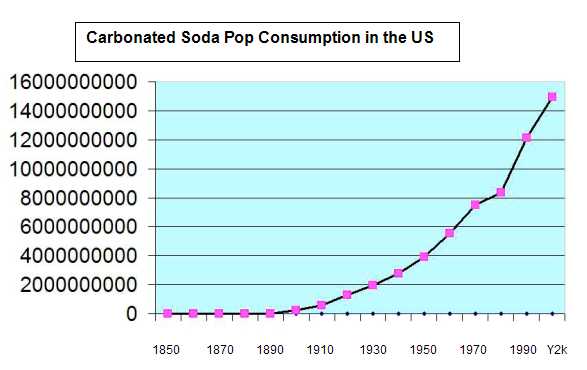
Sadly, BMC doesn’t have data that go back to 1855, and their reports, as far as far as I have been able to discern, only hit about the last 30 years. But we can derive the data if we look at US population history (data from http://www.tsl.state.tx.us/ref/abouttx/census.html) and calculate a reasonable fit curve- we sort of make up the data points that are missing in between the two end points (interpolate, for you math types), which practice fits perfectly with the IPCC Executive Summary conclusions (not the detailed report). Remember, we are not only seeing increased numbers of people, but carbonated beverage consumption of each of the people has also been skyrocketing over the period of interest. That, friends, is your real "hockey stick":

Now compare the US carbonated beverage consumption trend line with the proper section of the temperature changes over the same period:

How can you get a more persuasive cause and effect relation? I think that the Senate needs to clear the calendar and deal with this immediately. Forget unimportant stuff like war, budget earmarks, and Medicare solvency.
Despite overwhelming evidence that bovine flatulence releasing tons of pre-warmed methane up into the sky is a primary cause (http://www.cbc.ca/news/background/kyoto/ewe.html), it is most often asserted that the real chief culprit among such greenhouse gases is carbon dioxide.
As the graph below shows, this evil gas has been increasing in atmospheric proportion since about 1855. Note the curve- roughly linear from 1855 to 1960, with an upward spike from then till the present (Michael Mann’s famous "hockey stick"). Speaking of which, what was Mann doing messing with these hockey sticks instead of "Miami Vice", "Starsky and Hutch", or "Last of the Mohicans"? But I digress.

Now, in search of the true causes, let us look at the critical elements of history over these last 150 years that have been characterized by the accelerating CO2 concentrations. People say it is cars and power plants. Perhaps those sources might contribute, as do six billion humans who insist on not only inhaling, but exhaling 20 times a minute.
But, from http://inventors.about.com/library/weekly/aa091699.htm, we learn the sickening truth: ginger ale was invented in 1851. The term "pop", to describe carbonated beverages such as "soda pop", was coined in 1861. By 1876, root beer was being mass produced for sale.
Then came the big ones- the first cola drink in 1881 was succeeded by the invention of Dr. Pepper in 1885, closely lagged by the upstart Coca Cola in 1886, and then Pepsi-Cola in 1898. The "crown bottle cap" moved these poisonous beverages from the drugstore soda fountains into bottles kept in peoples’ homes, available to drink at any time, prompting unlimited growth in consumption. The barn door had now officially been blown off its strap hinges.
In accordance with the best current standards of scientific proof (that is, if you can find some piece of data somewhere to support your "deeply held beliefs"), the new statistical reality is that "correlation equals causation". We thus hereby claim that irrefutable proof, even better than the evidence that drove the Alar scare or magnetic fields from cell phones causing brain cancer. We now KNOW the anthropogenic causes of global warming.
It is obvious that the fundamental reason for the increasing levels of CO2 in the atmosphere is not humans burning fossil fuels, cow flatulence, or any similar phenomenon. It is the event that occurs millions of times each day, and mostly in the evil, cowboy, capitalistic world of George Bush’s "poisonous water and poisonous air" America: the "pffft" sound we hear every time another can top is popped or bottle cap is unscrewed.
Each time we pop open another can, that poison gas and pollutant, carbon dioxide, is carelessly and thoughtlessly released into the atmosphere to do its evil work, work such as melting the polar ice caps so that sea levels in Tuvalu drown the desperate population, icebergs are calved off of Antarctic glaciers into the sea, and the formerly snow-capped mountains of Kilimanjaro turn in to hilly deserts, thereby screwing up the local economy.
The cause, humans, is YOU- you selfish American consumers of Coca Cola, Pepsi, Dr. Pepper, and various brands of root beer, ginger ale, and so on.
Consider the data: at the beginning of this greenhouse gas tragedy in 1886, Coca Cola sold a total of 25 gallons of syrup to drugstores, and there were no real "bring home" sales because the stuff would go flat in those poorly sealed jugs. That 25 gallons made up about 200 gallons of ("old", not "The New") Coke, which, based on US population in 1890, equated to .0000031 gallons per person per year.
By 1999, according to Beverage Marketing Corporation (BMC), Americans were swilling 14,930 million gallons of the stuff (for the math-challenged among us, that is 15 billion gallons), which is about 55 gallons, per person, per year, an increase of umpty-ump times as much, a scientific-looking number with a big exponent- my calculator doesn’t have enough display capacity to actually show the number.
Sadly, BMC doesn’t have data that go back to 1855, and their reports, as far as far as I have been able to discern, only hit about the last 30 years. But we can derive the data if we look at US population history (data from http://www.tsl.state.tx.us/ref/abouttx/census.html) and calculate a reasonable fit curve- we sort of make up the data points that are missing in between the two end points (interpolate, for you math types), which practice fits perfectly with the IPCC Executive Summary conclusions (not the detailed report). Remember, we are not only seeing increased numbers of people, but carbonated beverage consumption of each of the people has also been skyrocketing over the period of interest. That, friends, is your real "hockey stick":
Now compare the US carbonated beverage consumption trend line with the proper section of the temperature changes over the same period:
How can you get a more persuasive cause and effect relation? I think that the Senate needs to clear the calendar and deal with this immediately. Forget unimportant stuff like war, budget earmarks, and Medicare solvency.
posted by Kurmudge at 9:47 AM
![]()

0 Comments:
Post a Comment
<< Home